WebClient supports displaying data in several basic charts based on the C3 and D3 JavaScript libraries. Chart.ctrl now allows you to display your data in pie, donut, line, bar, and spline chart formats. The grid should have exactly two columns of data. First, the label. Second, the quantitative data.
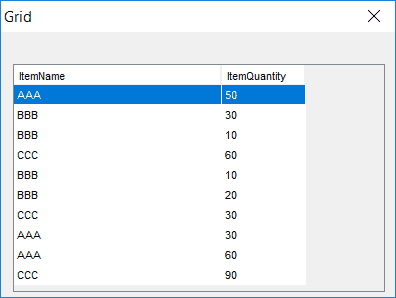
To implement it, the control name of the grid should follow the format below.
<grid control name>:<attachpoint>:template=Chart:chartType=<chart type>:default
For example:
Grid1P:MainArea:template=Chart:chartType=donut:default
The currently supported chart types are pie, donut, line, bar and spline.
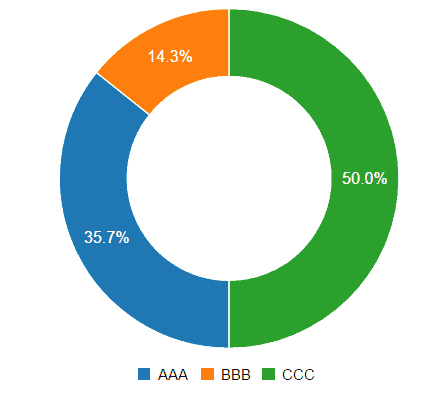
Donut Chart
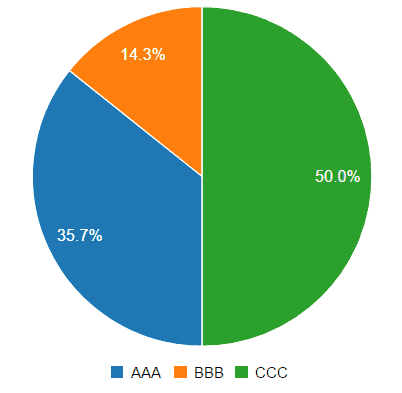
Pie Chart
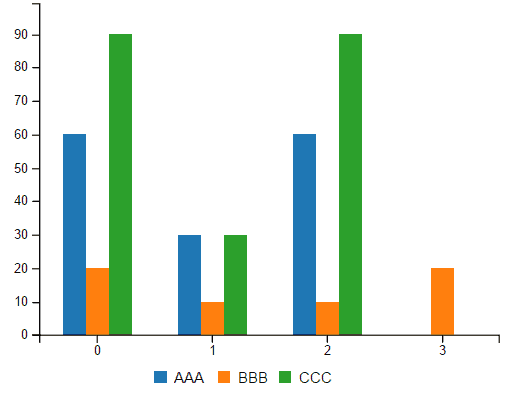
Bar Chart
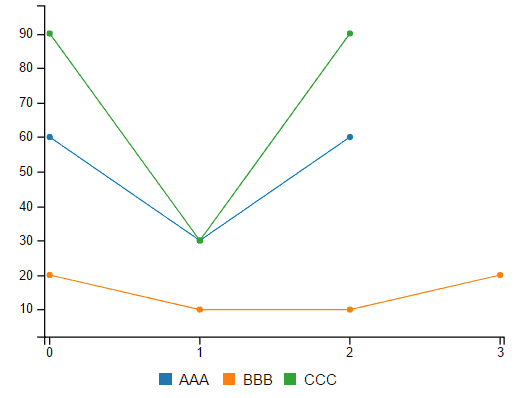
Line Chart
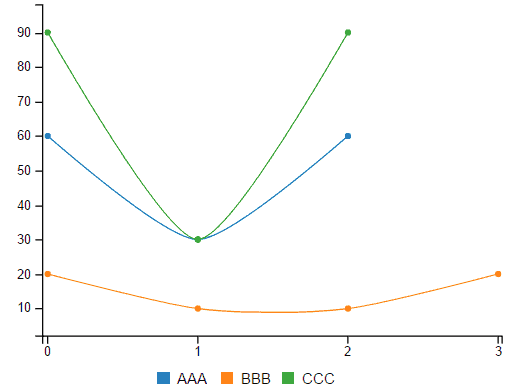
Spline Chart
C3 Library Reference: http://c3js.org/examples.html
