The Portfolio Dashboard provides a high-level view of trending inventory metrics and statistics with dead-simple configuration that can be designed for unique situations. With customized trending insight, issues can be targeted and addressed more efficiently than ever before.
View the video, or take a look at the screenshots below to see how.
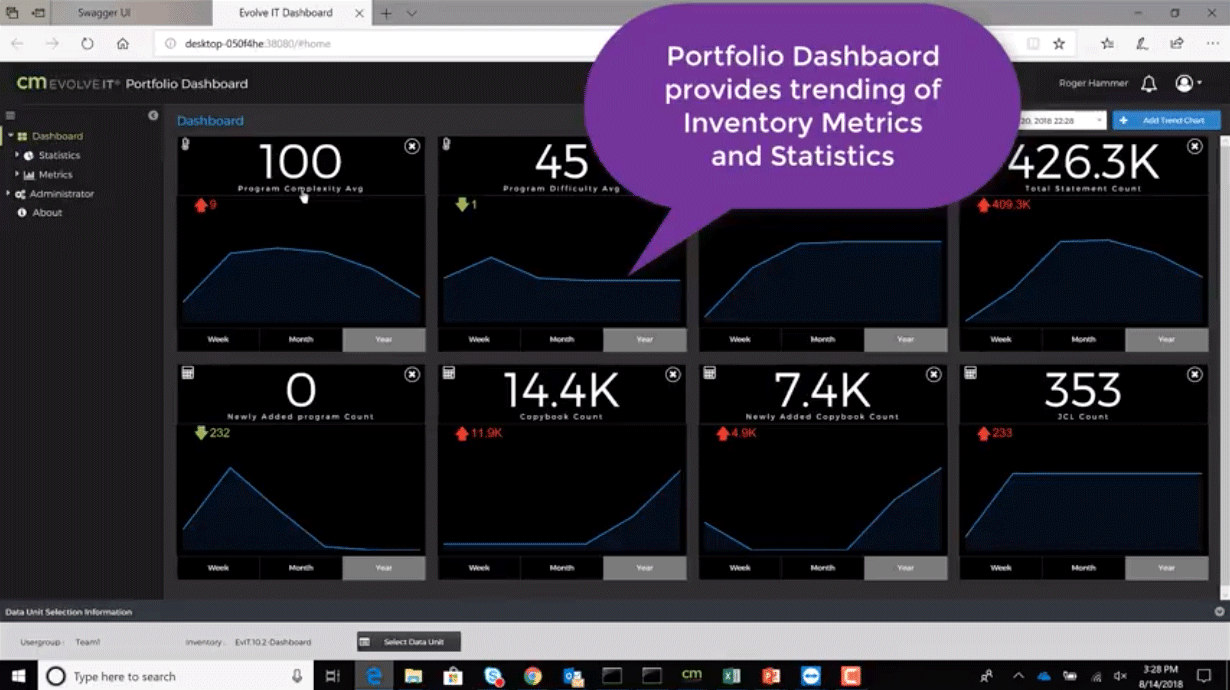
1. Portfolio Dashboard provides trending of Inventory Metrics and Statistics.
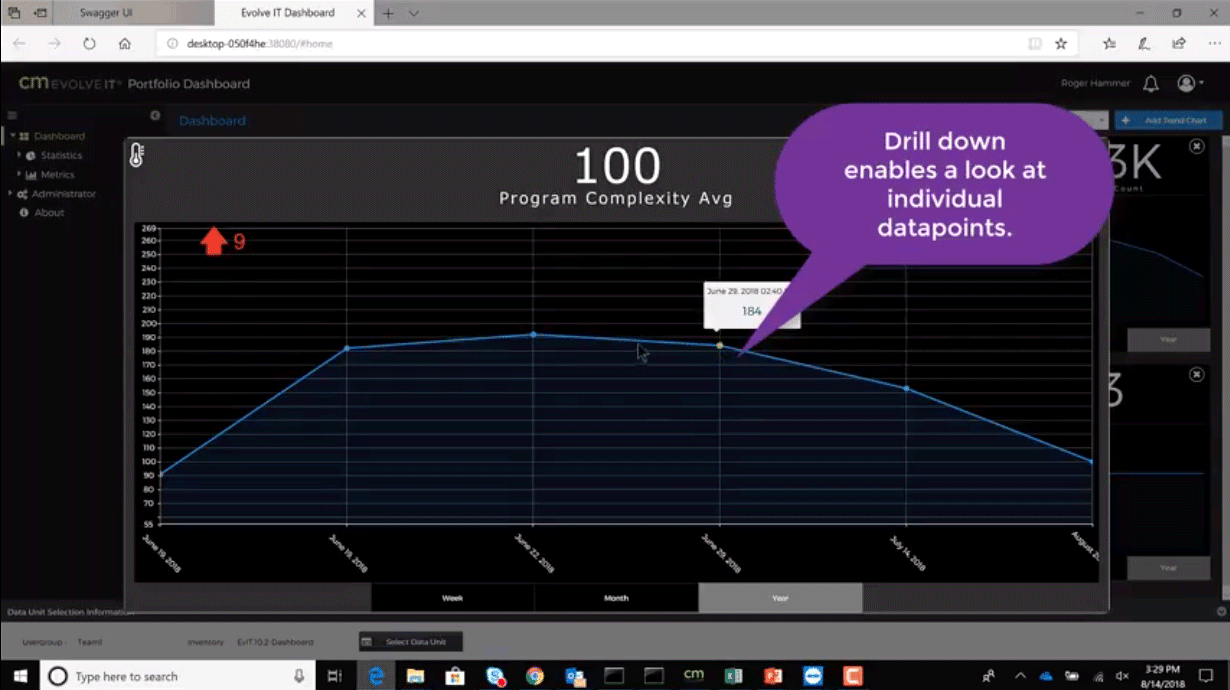
2. Drill down enables a look at individual datapoint.
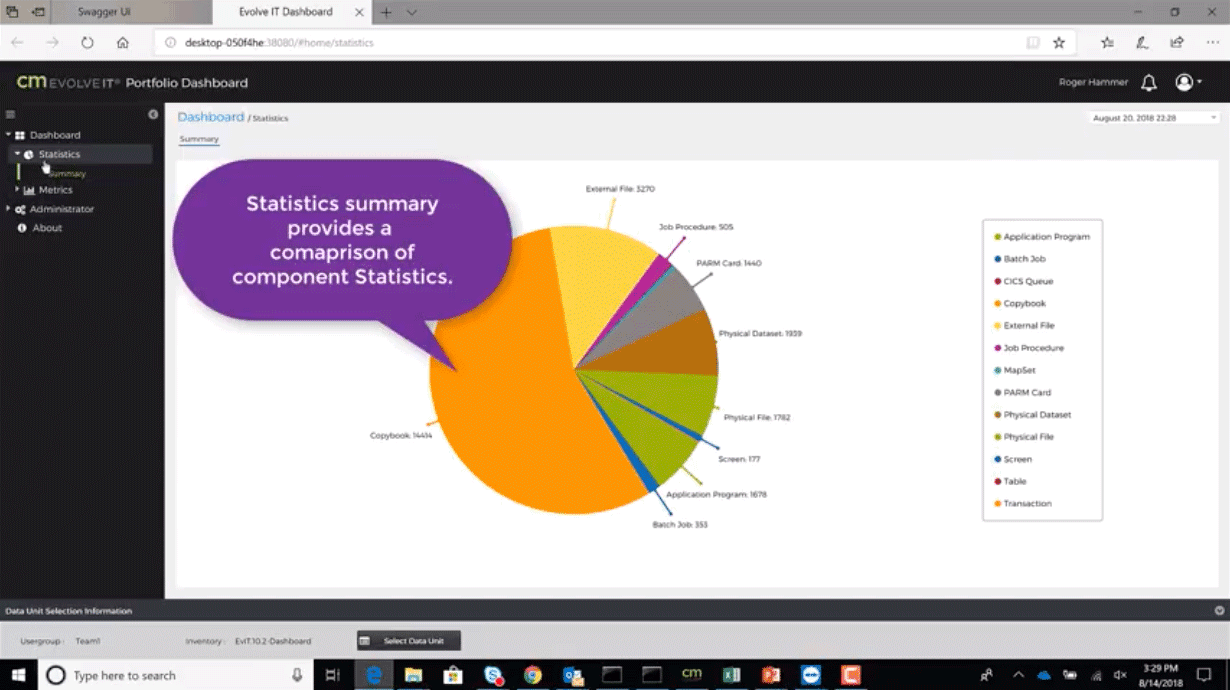
3. Statistics summary provides a comparison of component statistics.
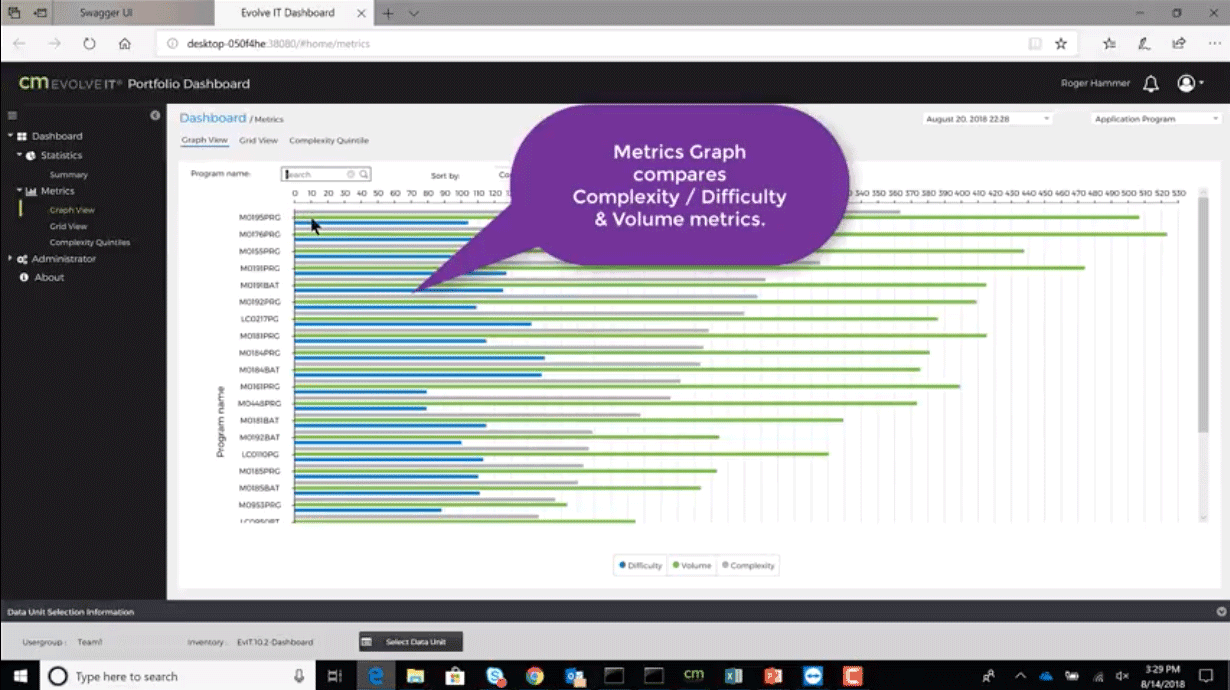
4. Metrics Graph compares Complexity/Difficulty and Volume metrics.
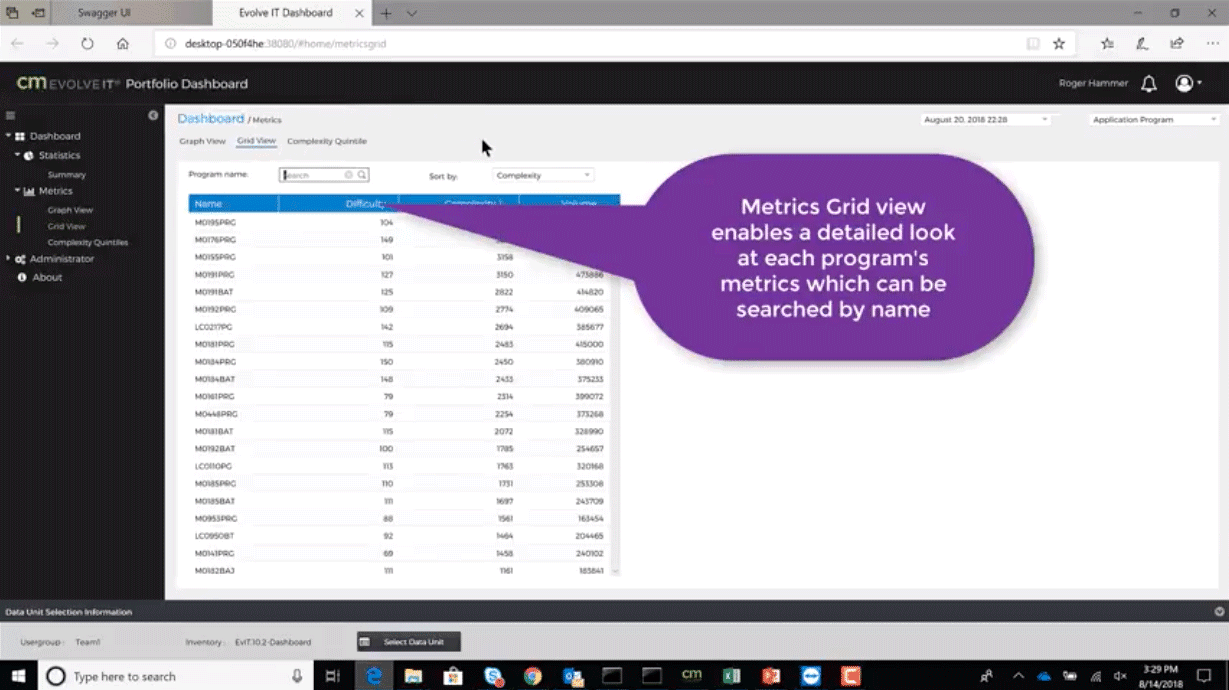
5. Metrics Grid view enables a detailed look at each program’s metrics which can be searched by name.
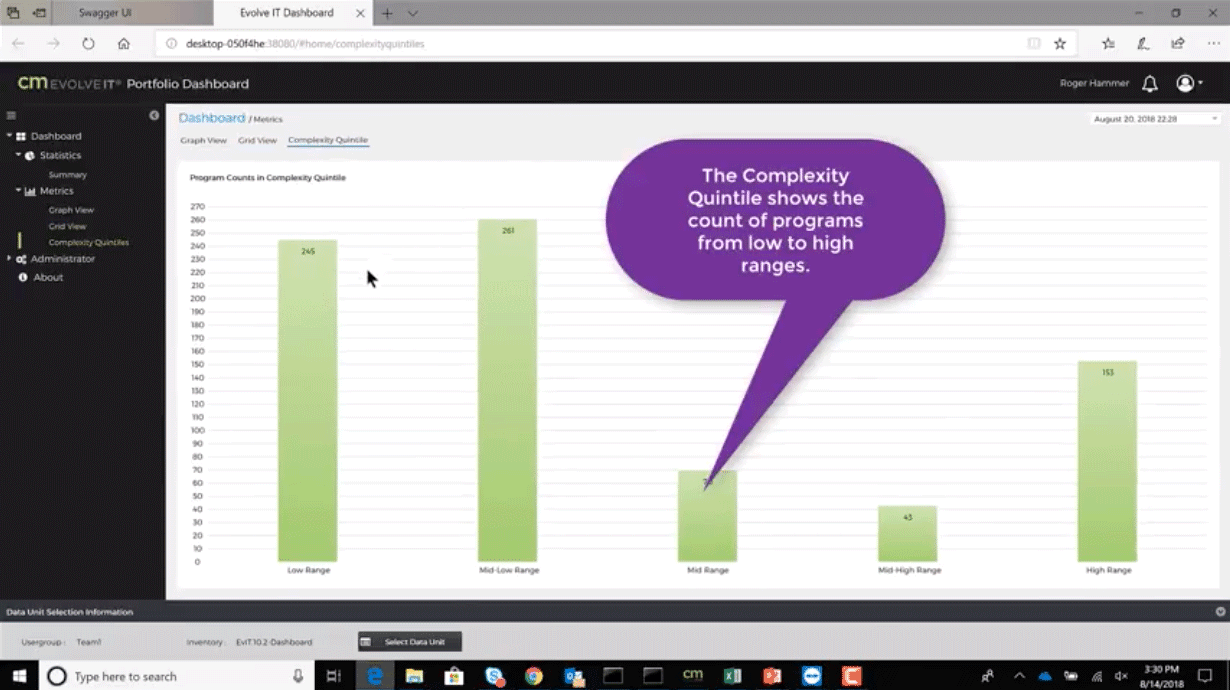
6.The Complexity Quintile shows the count of programs from low to high ranges.
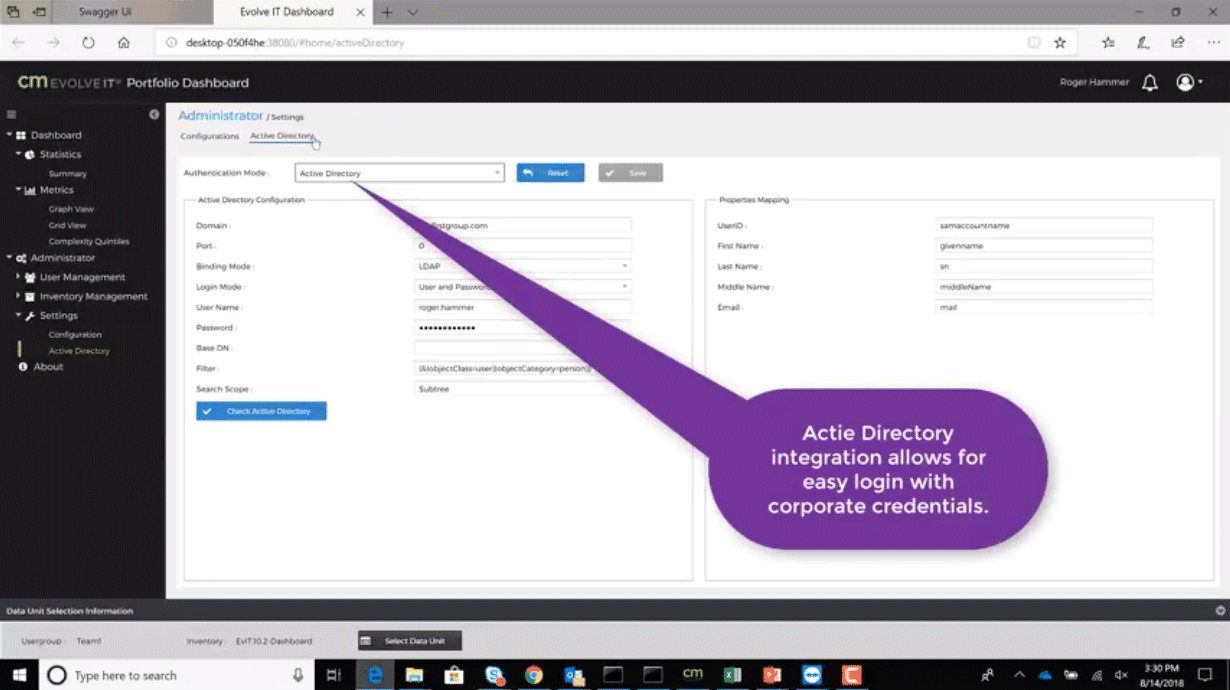
7. Active Directory integration allows for easy login with corporate credentials.
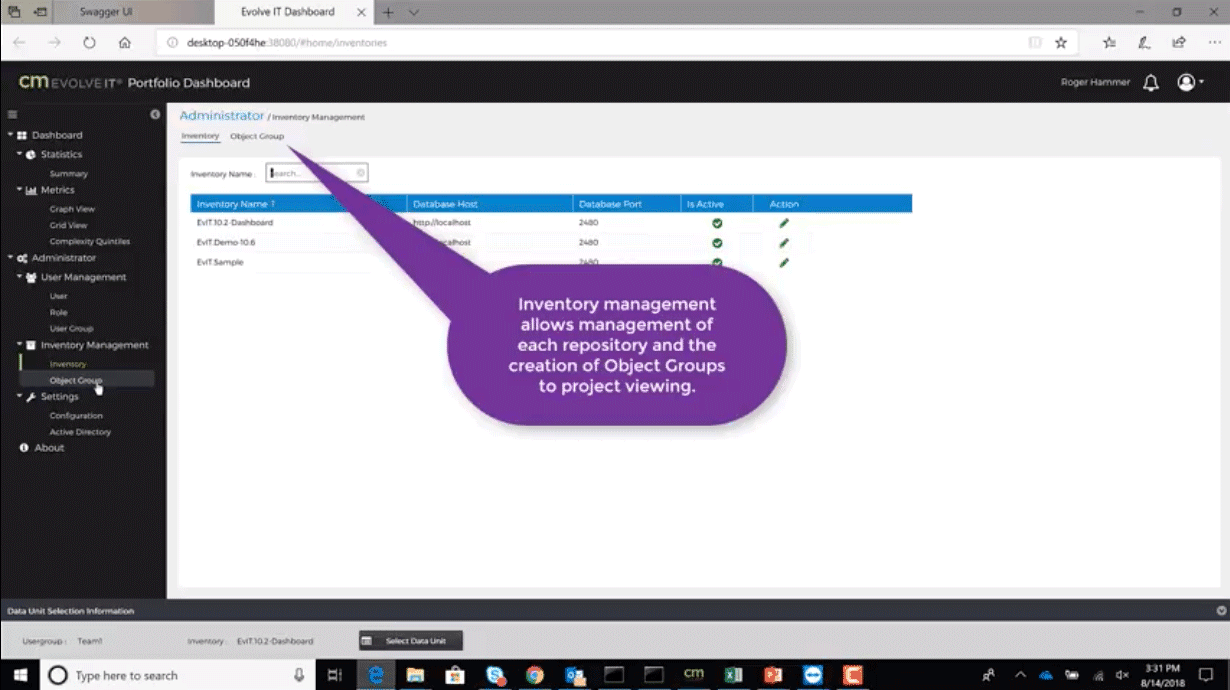
8. Inventory Management allows management of each repository and the creation of Object Groups to project viewing.
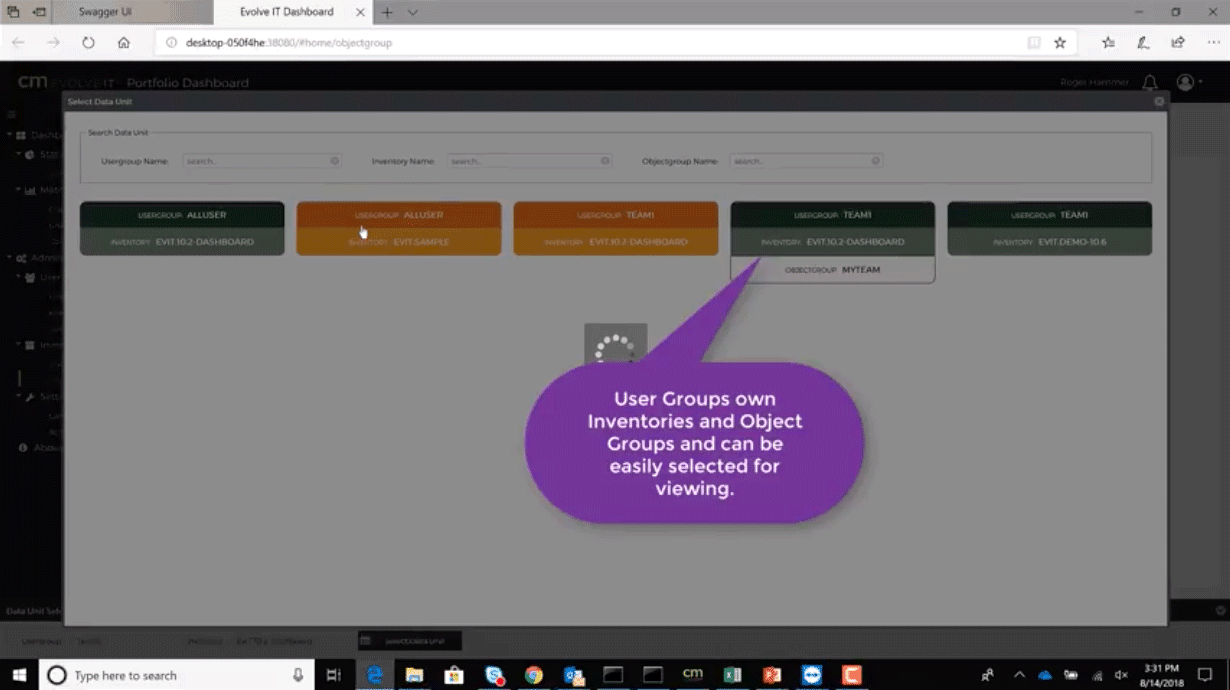
9. User Groups own Inventories and Object Groups can be easily selected for viewing.